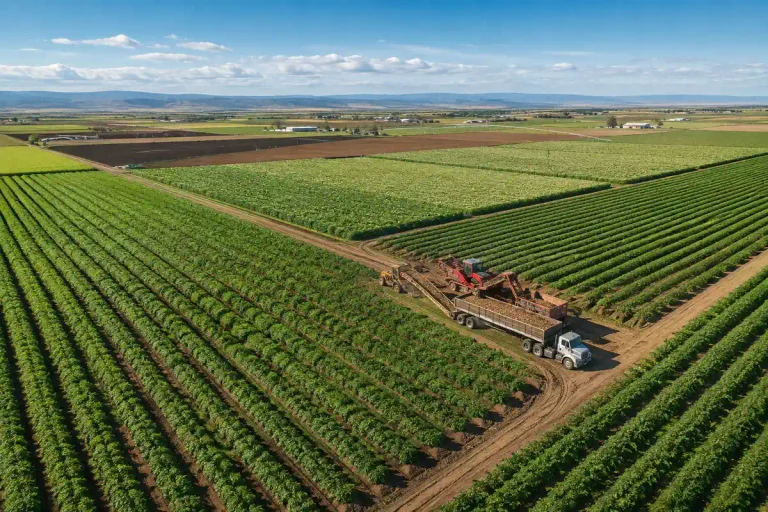
Top 10 Highest Potato Producing States in the US (2026)
See the top 10 potato producing states in the US with production data, yield per acre, and key insights into potato farming, processing, supply and markets for buyers, farmers and food plants.

Potatoes are one of the most widely grown food crops in the United States. The US produced 417.6 million CWT of potatoes in 2025, supplying homes, restaurants and food plants across the country. From fries and chips to frozen foods, potatoes support a large part of the national food supply chain.
This article covers the top 10 highest potato producing states in the US based on recent production data. It explains where potatoes are grown, how much each state produces and why these regions matter to farmers, food makers and buyers. All figures are shared in a clear way so they are easy to understand.
The data used here reflects commercial farm output, measured in hundredweight (CWT). One CWT equals 100 pounds.
Why Potato Production Matters in the US
Potato farming supports thousands of growers and workers across the country. Many food plants rely on a constant supply of potatoes for chips, fries, flakes and frozen foods. When production changes in one state, it can affect pricing, storage needs and transport across many regions.
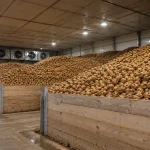
Potatoes also need careful handling after harvest. Sorting, grading and storage systems play a key role in keeping quality stable from farm to factory. Because of this, production numbers are closely linked with farming methods, climate and local systems.
Knowing which states lead in potato output helps buyers, food companies and farm planners make better supply decisions.
Also read: Top 10 Potato Producing Countries in the World
Top 10 Potato Producing States in the US
| Rank | State | Production (CWT) | Yield (CWT/Acre) |
|---|---|---|---|
| 1 | Idaho | 140.0M | 445 |
| 2 | Washington | 91.0M | 630 |
| 3 | Wisconsin | 29.1M | 435 |
| 4 | Oregon | 26.0M | 635 |
| 5 | North Dakota | 24.3M | 350 |
| 6 | Colorado | 23.0M | 420 |
| 7 | Michigan | 20.4M | 420 |
| 8 | Minnesota | 17.3M | 435 |
| 9 | Maine | 17.1M | 330 |
| 10 | Nebraska | 9.7M | 485 |
1. Idaho
Idaho is the largest potato-producing state in the US, with 140.0 million CWT harvested. Most of this output comes from large farms in the Snake River Plain, where controlled irrigation and well-managed soil support steady yields.
The average yield in Idaho is 445 CWT per acre. This supports both fresh potato sales and large-scale processing. Many frozen fry and packaged food plants rely on Idaho potatoes because of stable supply and consistent size.
2. Washington
Washington ranks second with 91.0 million CWT of potato production. It also records one of the highest yields at 630 CWT per acre, showing strong farm efficiency.
You might also like
-
 The Truth About Potato Peel Waste Around the World
-
 India Potato Exports to Indonesia in 2025 – Market Trends & Price Outlook
-
 Top 10 Potato Producing Countries in the World (2026)
-
 Top Benefits of Using a Nubbin Grader for Potatoes French Fries
-
 Aeroponics vs Traditional Potato Farming: Costs, Yields & Benefits
-
 Complete Frozen French Fries Production Line Guide (2026)
Most potatoes grown in Washington are used for processing, especially French fries. The Columbia Basin provides reliable water access, which helps farms maintain even crop quality across wide areas.
3. Wisconsin
Wisconsin produces 29.1 million CWT of potatoes. While the state is known for dairy farming, potatoes are a major crop, mainly grown in central regions with sandy soil.
The average yield is 435 CWT per acre. A large share of Wisconsin potatoes is used for chips and frozen products, supported by nearby processing plants.
4. Oregon
Oregon harvests 26.0 million CWT of potatoes and records the highest yield at 635 CWT per acre.
Most Oregon potatoes are grown under supply contracts for processing. Uniform size and shape make them suitable for factory use, which helps maintain consistent demand.
Also read: Potato Consumption Per Capita by Country
5. North Dakota
North Dakota produces 24.3 million CWT of potatoes, with an average yield of 350 CWT per acre. Shorter growing seasons limit yield compared to western states.
Potatoes here serve both fresh markets and processing needs. Storage planning is important because of long winters and extended transport distances.
6. Colorado
Colorado farms produce 23.0 million CWT of potatoes. The average yield is 420 CWT per acre, close to the national level.
High-altitude growing areas support good skin quality and firmness. Many Colorado potatoes are sold fresh, with some used in specialty food markets.
7. Michigan
Michigan produces 20.4 million CWT of potatoes, with an average yield of 420 CWT per acre. Access to water and crop rotation supports stable production.
The state supplies both fresh markets and processing plants. Its central location helps food companies serve customers across the Midwest.
8. Minnesota
Minnesota produces 17.3 million CWT of potatoes and records an average yield of 435 CWT per acre.
Processing potatoes make up most of the crop. Careful timing and storage management help maintain supply during colder months.
9. Maine
Maine harvests 17.1 million CWT of potatoes. The average yield is 330 CWT per acre, reflecting cooler growing conditions.
Most Maine potatoes are grown for table use. Strong storage systems allow growers to supply nearby states well after harvest season.
Also read: Wisconsin Potato Industry: Production, Processing & Market Outlook
10. Nebraska
Nebraska produces 9.7 million CWT of potatoes, completing the top ten list. The state shows a strong yield of 485 CWT per acre, even with smaller growing areas.
Most production serves regional markets, where shorter transport distances help reduce handling loss and cost.
What These Numbers Mean for Buyers and Food Plants
High production states often support large food factories that need regular and large volumes of potatoes. These states are better suited for chips, fries, flakes and frozen food plants that run year-round. Large output helps reduce supply risk and keeps factory operations stable.
Smaller producing states usually serve nearby or regional markets. They play an important role in meeting local demand and reducing transport distance. While their total output is lower, they often support fresh potato sales and short supply chains.
Yield per acre shows how much land is needed to meet demand. States with higher yields can supply more potatoes using less farmland. This matters when land, water or labor is limited.
For food processors, regular supply often matters more than raw volume alone. Climate conditions, water access, storage systems and post-harvest handling all affect how reliable that supply is. These factors shape real availability, not just production totals.
Conclusion
Potato production in the US depends on climate, land use, water access and farm planning. Idaho and Washington lead in total output, while other states support regional supply and processing demand.
As food demand continues, production and yield data will remain important for growers, buyers and food plants when planning supply and investment.
Also read: North Dakota Potato Industry 2026: Production, Processing and Markets
FAQs:
-
Which US state produces the most potatoes?
Idaho leads with about 140 million CWT of production.
-
Which state has the highest yield per acre?
Oregon records the highest potato yield at 635 CWT per acre.
-
Are potatoes grown mainly for fresh use?
No. A large share is used for fries, chips and frozen foods.
-
Why are western states strong in potato farming?
Large farms, irrigation access and stable weather support output.
-
What unit is used to measure potato production?
Production is measured in hundredweight, or CWT.
Image credit: Potato Insights
Sources and references:
- Potato Production by State 2026, World Population Review — data for 2025.
- Potatoes 2025 Summary, USDA National Agricultural Statistics Service, 2025 crop, released September 2026.
- USDA’s September 2026 report states that total 2025 U.S. potato production was 417.594 million CWT, with an average yield of 462 CWT per acre
- USDA National Agricultural Statistics Service – Potatoes
Recent Articles

"Get the latest potato industry updates in Google Search. Add Potato Insights as a preferred source for potato markets, processing, trade and industry news."